You pay premiums, you don’t use the policy, and you get your money back. Sounds like a good deal, right? Of course it does. Who wants to give away their money? Of course, donating to charitable organizations is important, but who has ever heard of donating to an insurance company?
This sounds great, but what will it cost? Is this the best use of money? Like all insurance, you can’t make a blanket statement whether a rider is “good” or “bad” for an entire group of people. I hope what I found digging into the numbers and specimen contracts helps you decide if it’s worth it for your clients on an individual basis.
How does the rider work?
The simple answer is: if you don’t use your policy, you get money back. Of course, it wouldn’t be any fun if each carrier worked in the same way so here’s the breakdown.
- Carrier A: Returns 50% of your premium every 5 years, minus any benefits paid.
- Carrier B: Returns some premium upon cancellation, policy lapse, death or age 67. In each quote they have a table with the amount returns depending on the policy year. If you graphed the premium returned over time, you would end up with an exponential curve (which looks like the bottom half of the number 5.)
- Carrier C: At age 67, returns 100% of premium minus any benefits paid.
- Carrier D: You can select either an 80% or 50% returned at the end of 10 years, minus any benefits paid.
What does this look like in terms of numbers and premium?
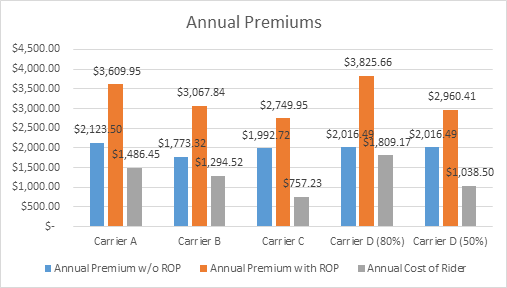
I ran sample rates to see what the premiums paid and returned would look like. I asked myself what I would advise my friends and family to do. Our sample client is age 30, female, Arizona resident, office management making $100,000 annually, non-smoker and healthy. I quoted her a $5,000 benefit to age 67 with residual and a modified own occupation definition to age 67. According to the Council for Disability Awareness, our client has a 19% of becoming disabled for three months or longer. Numbers below.

In many cases, the cost of the rider is almost as much as the cost of the rest of the contract.
What does that look like over the next 37 years?
| Total Premium w/out ROP | Total Premium w/ ROP | Total Refunded Premium | Actual Cost of ROP Policy | |
| Carrier A | $78,569.50 | $133,568.15 | $66,784.11 | $66,784.04 |
| Carrier B | $65,612.84 | $113,510.08 | $113,510.00 | $0.08 |
| Carrier C | $73,730.64 | $101,748.15 | $101,748.15 | $0 |
| Carrier D (80%) | $74,610.13 | $141,549.42 | $113,239.54 | $28,309.88 |
| Carrier D (50%) | $74,610.13 | $109,535.17 | $75,490.45 | $34,044.72 |
Out of the millions of financial scenarios for our clients, let’s pick two. In Scenario A, she is fiscally responsible and already into investing, saving and otherwise building wealth. In Scenario B, she is not in the habit of investing and is unlikely to be responsible enough to put away money every month toward investment or retirement (outside of her 401k). Either way, she’ll buy the policy because that’s the smart thing to do. In Scenario A, would the return from investing that money elsewhere be better over the next 37 years than ROP? In Scenario B, she’s saving a ton of money with the return of premium.
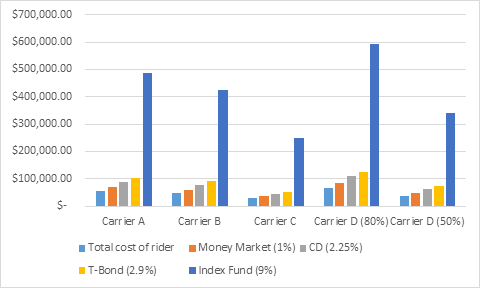
First, let’s project the current market 37 years out for each carrier using the annual cost of the ROP rider each year until she’s 67 to see what the numbers look like. (Disclaimer: I am not a financial advisor and this projection was done with basic Investing & Finance 101 knowledge and assuming these rates are stable, which they are not. These numbers are purely to look at the theory of ROP and not for investment purposes.)
The chart shows these investments might look like 37 years down the road.

Where does the money go for Client A and Client B?
| Net Cost w/ ROP | No ROP w/ Money Market | No ROP w/ CD | No ROP w/ T-Bond | No ROP w/ Index Fund | |
| Carrier A | $(66,784.04) | $(9,863.28) | $10,670.87 | $24,860.47 | $407,779.34 |
| Carrier B | $(0.08) | $(5,777.95) | $12,104.84 | $24,462.28 | $357,938.77 |
| Carrier C | $0 | $(38,730.20) | $(28,269.65) | $(21,041.16) | $174,026.05 |
| Carrier D (80%) | $(28,309.88) | $9,012.75 | $34,005.02 | $51,275.30 | $517,328.87 |
| Carrier D (50%) | $(34,044.72) | $(26,608.91) | $(12,262.85) | $(2,349.36) | $265,174.77 |
The first column shows what she will pay over the course of the contract with ROP. The other columns are the non-ROP contract with the value from her investments at age 67. The non-bracketed numbers show when she comes out ahead.
Is Return of Premium worth it?
Before I understood that people don’t always make logical decisions, I would have said absolutely not. But as I get older, and hopefully wiser, I keep discovering that many people are not very good at delaying instant gratification for long term gain. If it were my sister in scenario B, I would say spend the money on ROP now to do yourself a favor in the long run. If my sister were more of the scenario A type, I would argue the return on investment is better without the ROP rider. And I’m sure my dear reader, that you can put together much better investments for our clients than I can.
